Managing the varying responsibilities that accompany building a successful brand on Amazon or any eCommerce store can be exhausting. But weary not, there is a range of tools and services available to assist you in optimizing your Amazon Listing.
These 10 tools and services can help you maximize your listings conversion rate, implement Off Amazon marketing strategies, and increase your customer lifetime value. We will discuss in this blog post ten (10) tools and services Amazon sellers need to help them take their business to the next level.
1. Evolve Media Services
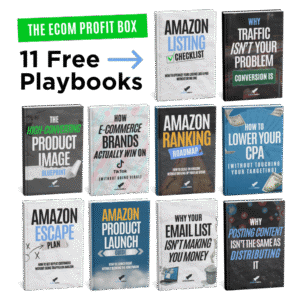
The first service you need to consider is Evolve Media Agency. That’s us! We are an Amazon Marketing Agency helping sellers boost the conversion rate of their listings with photo and video content, graphic design, general content creation, Amazon marketing strategies, etc. We can also help you upgrade or revamp your Amazon listing; get it converting and performing much better. My team and I have a ton of conversion rate boosting strategies we regularly implement for our Amazon clients. These boosting strategies are available for you to use at zonchecklist.com in our free Amazon Listing Checklist.
At Evolve Media, we help sellers rank higher, get more reviews, increase their PPC Return on Ad Spend (RoAS), Off Amazon marketing strategies, etc. We also have a service that helps Amazon sellers download their Amazon Customer Data; names, mailing addresses, emails, and phone numbers. If you need help scaling up your Amazon business, book a free consulting call with us at evolvemediaagency.com.
2. Helium10

The second tool that we recommend to Amazon sellers is Helium10. Helium10 is currently one of the popular tools out there. Helium10 helps you manage and sell products, find keywords, optimize listings, streamline advertising campaigns, identify trends, etc. Their platform is intuitive and easy to use and understand. You can do ASIN research to see which keywords are for a particular ASIN rank. Helium10 is well-priced, and I recommend you get started with it.
3. Seller.Tools

Tool number three is Seller.Tools. Seller Tools help you analyze your listing and examine what keywords you’re indexing for. They can help with light keyword research on the Amazon platform. Type in a search term on Amazon, and it will show you all the different keywords around that search term. They also provide keyword insights such as monthly searches and the top three ASINs getting the most sales and clicks from that keyword. There are a lot of different benefits that Seller Tools offers, but our favorite is their chrome extension. If you want to save 20% on your Seller Tools monthly plan, use the promo code SAVE20 when you signup or upgrade your free account to a paid plan.
4. AMZalert

AMZalert is a notification tool that provides important updates about your listings or your competitor’s listings. To get alerts on ASINs, all you need is the Seller or Marketplace ID and the ASIN number of the product or listing. You can set up alerts for Inventory Levels, BSR changes, keyword ranking changes, etc. I highly recommend you check out AMZalert if you want notifications via text, email, or even slack, on what is happening with your listing. More so if you find it needful to stay ahead on every issue concerning your listings.
5. Pixelfy.me
The fifth tool I recommend is Pixelfy.me. Pixelfy is a linking tool. Anytime you’re driving external traffic to a landing page, then from the landing page to Amazon, use Pixelfy’s keyword-rich URL. Pixelfy gives you keyword attribution when shoppers click and buy from that keyword. Remember also to use a keyword rotator when using Pixelfy. Put ten (10) to twenty (20) different keyword URLs to rotate through because pushing a ton of sales through one keyword or phrase can quickly get you on Amazon’s radar and a warning from them. Use the Supreme 3.0 link that Pixelfy offers, add keywords to it, and put it on a rotator. Doing this also offers a steady growth to your rankings on Amazon. If you want to save 10% on your Pixelfy monthly plan, use the promo code SAVE10 when you sign up.
A little side tip that many Amazon Sellers miss out on is optimizing their Customer Questions and Answers area. Amazon’s Customer Q&A session is a great place to stuff specific keywords and phrases for which you want to rank. Your Amazon Customers‘ Q&As are indexed, and you can rank for those keywords. So definitely use the Customer Questions and Answers section.
6. Seller Candy

Seller Candy helps you when interfacing with Amazon. Should Amazon suspend or have issues with your listings, Seller Candy can take care of all those issues on your behalf. Seller Candy is a valuable resource for more established sellers and sellers who have a lot of ASINs. You can offload issues with managing ASINs and other time-intensive tasks to Seller Candy. So if you’re experiencing a lot of issues and frustrations with your Amazon ASINs and listings and you want to outsource, I recommend Seller Candy. Mention Ian or Evolve Media, and you can save a hundred dollars ($100.00) on your first month using their platform.
7. Klaviyo/Lemlist
Tool number seven is between two different options; Klaviyo and Lemlist. Both are email marketing tools and services Amazon sellers need, but with slightly different approaches. Klaviyo is an email marketing client that helps you email market to customers who have opted to receive emails from you. Lemlist, on the other hand, specializes in cold email marketing: sending email marketing campaigns to customers who haven’t opted in to receive emails from you.
Cold email marketing would likely to get your emails landing in the junk folder since your domain name may not be in good graces with major email clients like Gmail and Outlook. Lemlist has a tool called Lemwarm that helps you avoid the junk folder and boosts your deliverability rate. Lemwarm is the go-to resource to warm up your emails when you are cold email marketing.
You can also set up a dedicated sending domain with your DNS settings to link your domain name with Klaviyo. This approach also increases your deliverability rate and helps you avoid junk folders. Should you decide to do cold email marketing through Klaviyo, send out emails at a smaller scale, and ramp it up steadily. Also, run those emails through NeverBounce to clean up your list and reduce your bounce rate before sending out your campaigns.
If you want to learn more about cold email marketing, book a free call with us at evolvemediaagency.com. You will also find our free Amazon marketing strategies that help you optimize your Amazon listings at zonchecklist.com.
8. Landing or Bridge Pages
Landing pages are essential tools for driving external traffic to your Amazon listings. Use landing pages as bridge pages, and drive traffic from your Google search campaigns to them. ClickFunnels, LeadPages, and LandingCube are page-building platforms that can help you build your product landing pages. Driving external traffic to a landing page helps warm up your shoppers, get them pre-sold on your product, offer a coupon, or do an email popup to collect their email addresses. Remember to use a Pixelfy link to get them over to your Amazon listing. This approach gives you keyword attribution, which will boost your organic and keyword rankings on Amazon.
9. Google Search Ads
Google Search is the second-largest product search engine. About thirty percent (30%) of all product searches happen on Google. The first is Amazon. You want your products to show up when shoppers search either on Google or Amazon. Google Search ads put you at the top of their Search Engine Results Page (SERP) for the specific keywords or search phrases you bid for. You can drive the traffic from there to either your landing page or your Amazon listing.
10. Loom
The last among the tools and services Amazon sellers need is Loom. Loom is a screen-sharing software that allows you to easily communicate with your team members. You can easily record your screen with audio or speech capture as you’re recording. Recorded videos are also readily available after the recording. You can have your video hosted on a landing page where it has your logo and branding. Loom is helpful with internal communication. If you’re an agency like us, work with different clients and people, and you want to look very professional, shoot more Loom videos when communicating.
These are our top ten (10) tools and services Amazon sellers need to be working with. Hopefully, you got some value. As an agency, we use these tools regularly, and they are beneficial. So again, if you want to book a free consulting call with us or learn more about our services, visit evolvemediaagency.com. You can also access our free Amazon Listing Checklist at zonchecklist.com. Thank you for reading.